2016 American Community Survey State Rankings
(Characteristics for U.S. and top / bottom ranked state )
Poverty .............14.0 %
Mississippi ... ...20.8 %
New Hampshire...7.3%
College Grads ... 31.3 %
Massachusetts... 42.7%
West Virginia .... 20.8 %
Foreign Born. ...13.5%
California ......... 27.2 %
West Virginia... 1.7 %
Married Couple Households .....47.9 %
Utah ..................61.3 %
Rhode Island.... 42.3 %
click on links above for ranks and error ranges for all states
See the Census Bureau Website for more
2010-2016 race/ethnic %'s for the United States
| Race | 2010 | 2016 |
|---|---|---|
| White (NH) | 64.0% |
61.3% |
| Black (NH) | 12.3% |
12.4% |
| Asian (HN) | 4.7% |
5.5% |
| All Other (NH) | 2.7% |
3.0% |
| Hispanic | 16.3% |
17.8% |
| Total Minority | 36.0% |
38.7% |
State Population Growth Rates (%): 2010-2016
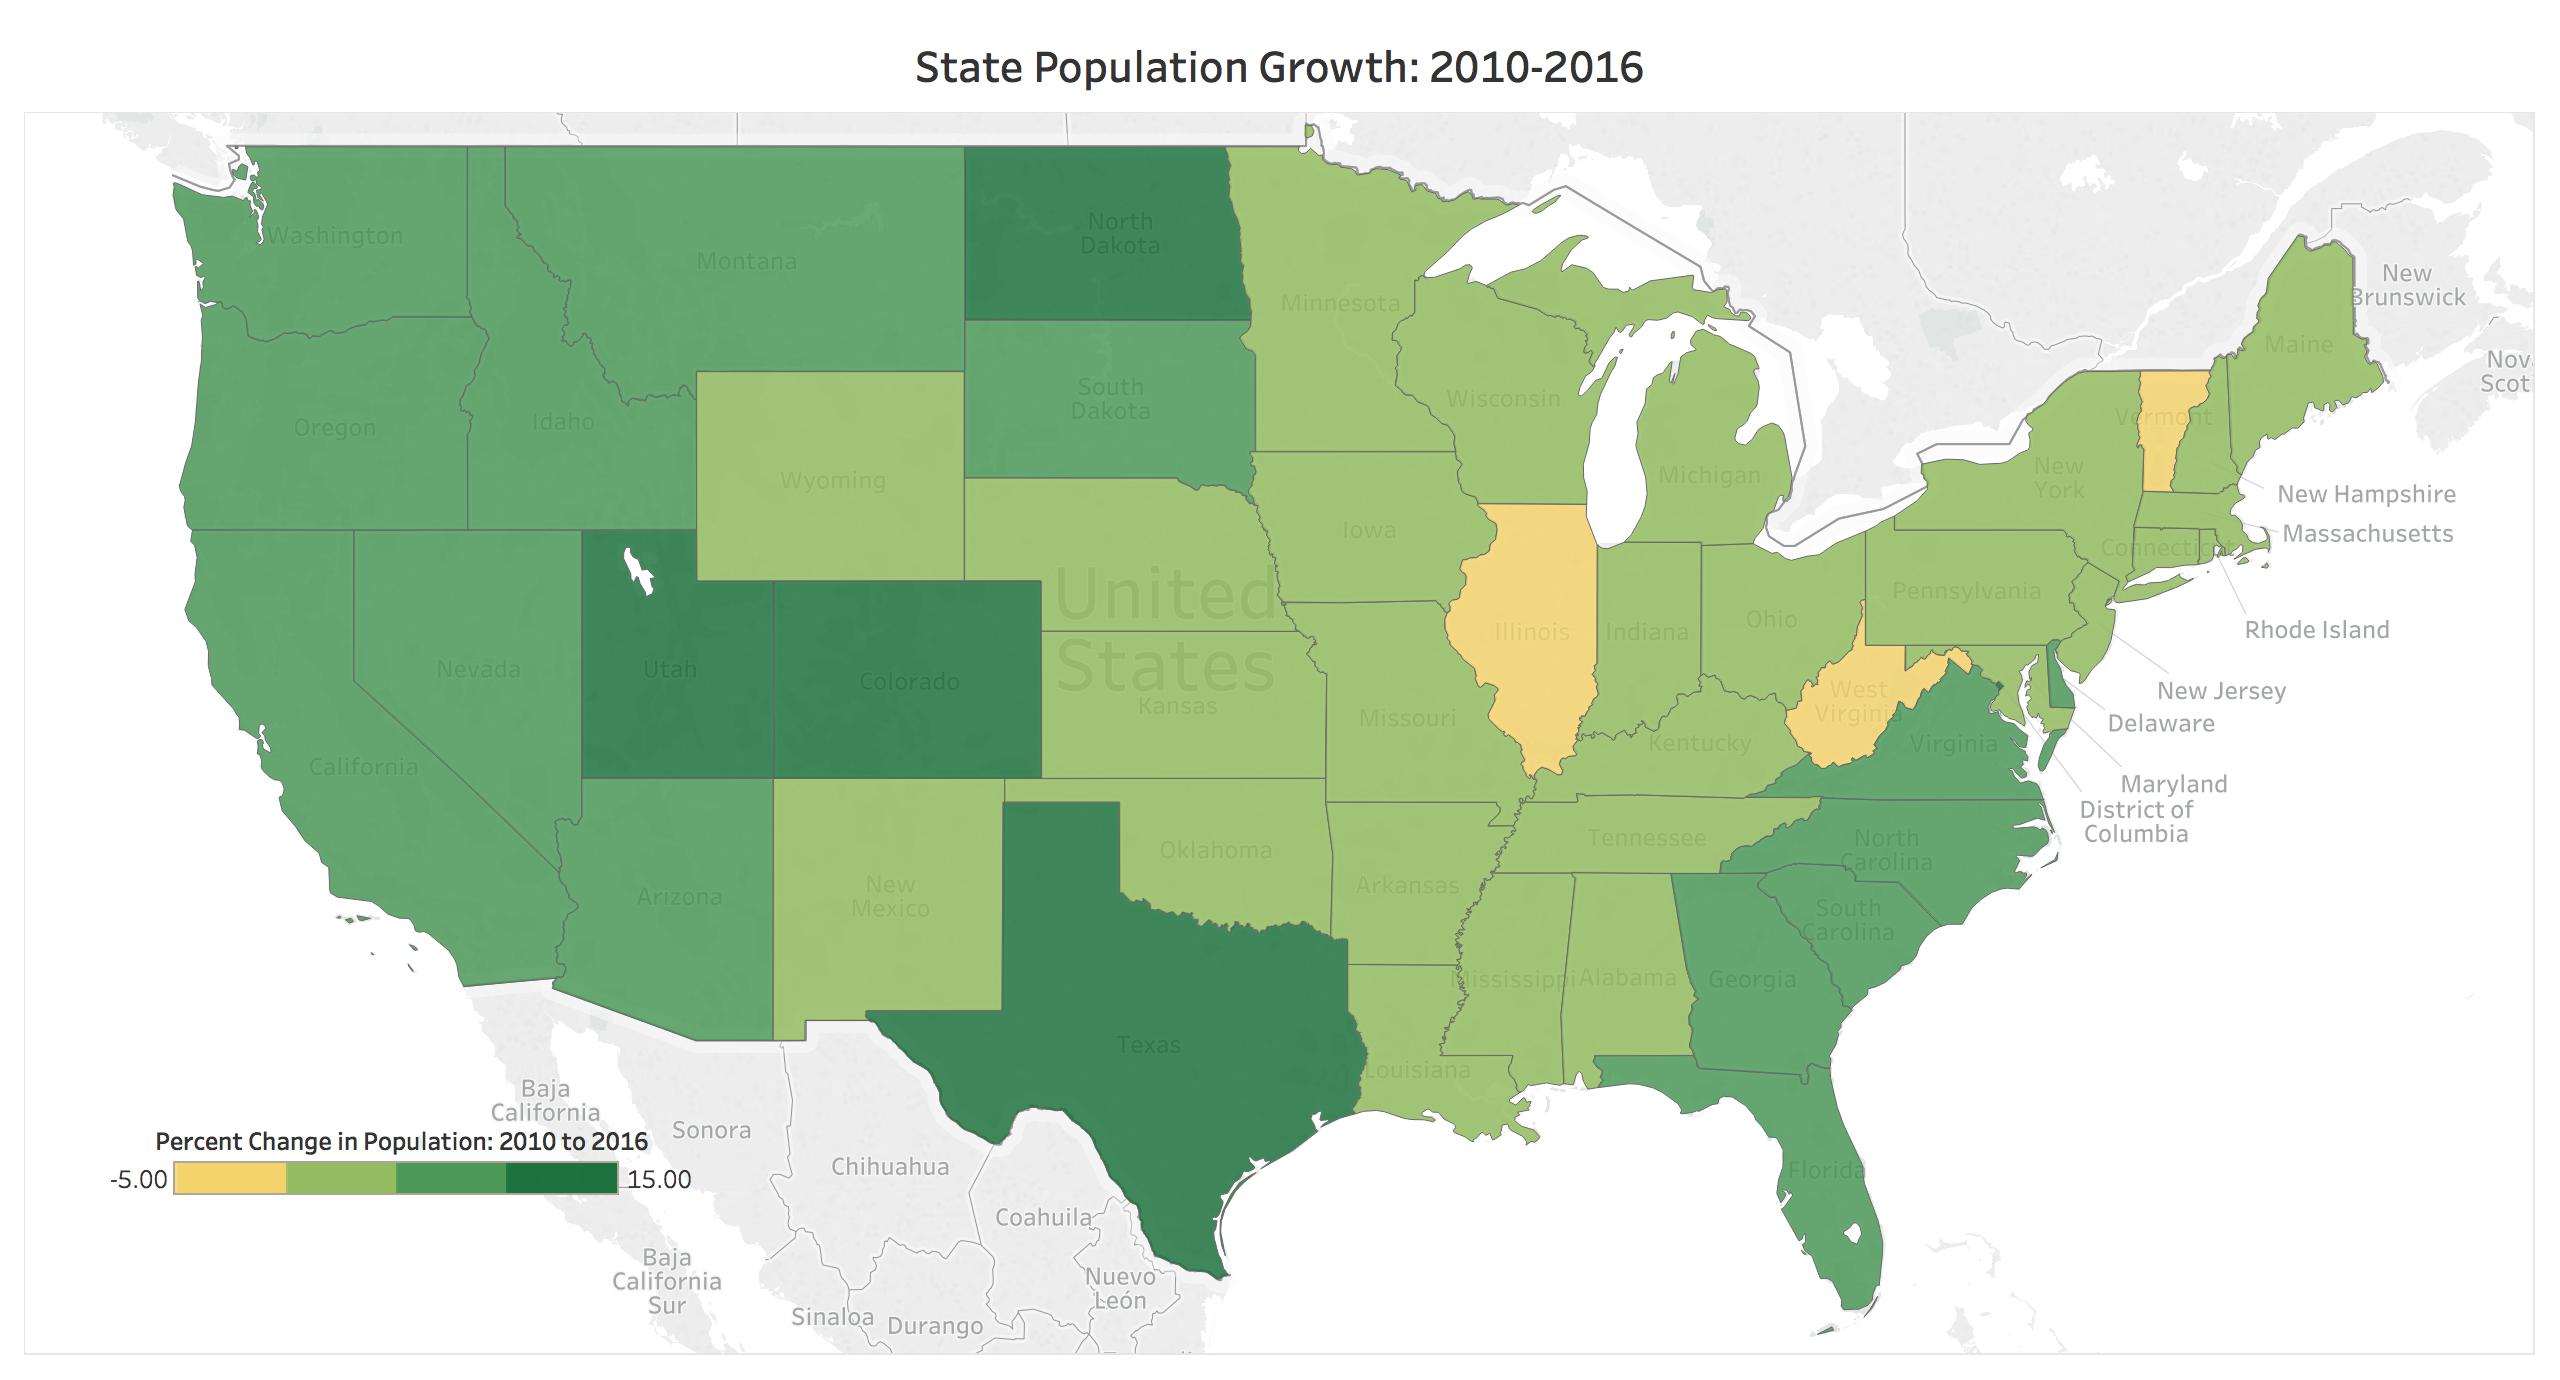
% Population growth for the United States: 2010-16
| Total | 4.7 % |
|---|---|
| White (NH) | 0.3 % |
| Black (NH) | 6.1 % |
| Asian (HN) | 21.0% |
| All Other (NH) | 16.1 % |
| Hispanic | 13.8 % |
| Total Minority | 12.3 % |